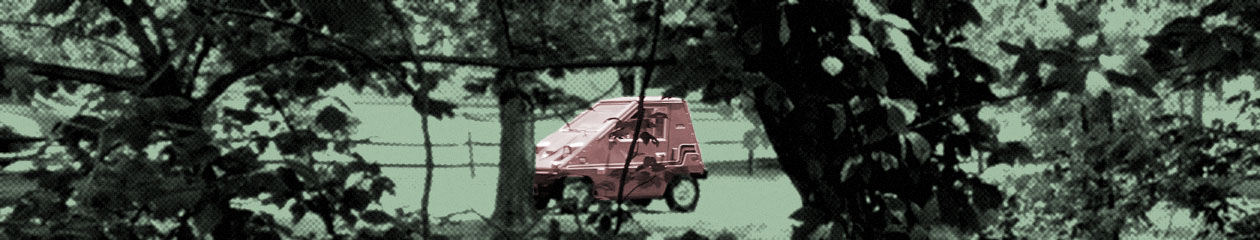
A log of small trips around the neighborhood in my little CitiCar.
| Date | Trip | Energy | Cost | Miles | Cost | Energy |
|---|---|---|---|---|---|---|
| kWh | per mile | Wh per mile | ||||
| July 11 | Maiden Voyage | 3.51 | 35.6¢ | 8.4 | 4.2¢ | 417 |
| July 14 | Ice Cream Run | 2.62 | 26.6¢ | 7.8 | 3.4¢ | 336 |
| July 15 | Gertrude Miller Park | 1.97 | 20.0¢ | 6.5 | 3.1¢ | 303 |
| July 16 | Radial Tire Upgrade | 1.51 | 15.3¢ | 4.7 | 3.3¢ | 321 |
| July 18 | Royal Excursion | 2.71 | 27.5¢ | 8.8 | 3.1¢ | 308 |
| July 25 | Downtown Expedition | 2.37 | 24.1¢ | 7.7 | 3.1¢ | 308 |
| July 26 | Custard Greenway | 2.08 | 21.1¢ | 7.2 | 2.9¢ | 289 |
| July 28 | Stock Radials | 1.31 | 13.3¢ | 4.7 | 2.8¢ | 279 |
| July 30 | Re-Fuse to Fix | 2.32 | 23.6¢ | 8.5 | 2.8¢ | 273 |
| July 31 | Skyline Soccerplex | 2.33 | 23.7¢ | 9.2 | 2.6¢ | 254 |
| August 20 | Gazebo Gatherings Summer Concert Series Season Finale | 2.30 | 23.4¢ | 8.7 | 2.7¢ | 265 |
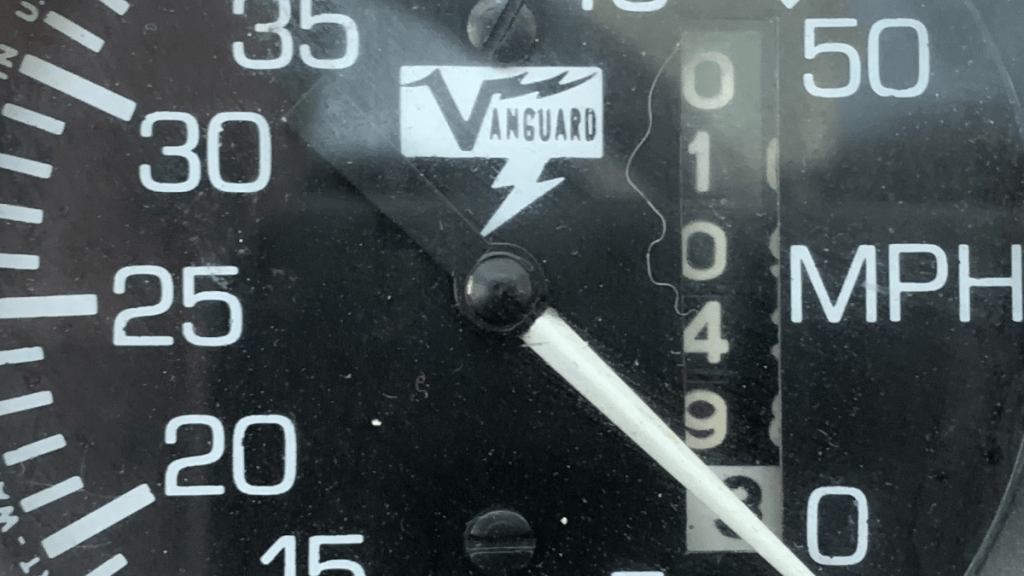
| August 21 | One Hundred | 2.35 | 23.9¢ | 9.3 | 2.6¢ | 253 |
| August 26 | Custard Package Drop Off | 2.46 | 25.0¢ | 9.5 | 2.6¢ | 259 |
| August 29 | Two Aught | 2.21 | 22.4¢ | 7.8 | 2.9¢ | 283 |
| August 30 | Art Walk | 1.92 | 19.5¢ | 8.2 | 2.4¢ | 234 |
| Sep 2 | Popeyes & Gertrude | 1.57 | 15.9¢ | 6.6 | 2.4¢ | 237 |
| Sep 5 | Speedometer Test | 2.01 | 20.4¢ | 6.9 | 3.0¢ | 291 |
| Sep 8 | Pelican Break | 1.58 | 16.0¢ | 5.9 | 2.7¢ | 267 |
| Sep 9 | Gertrude Glasses | 1.51 | 15.3¢ | 5.9 | 2.6¢ | 255 |
| Sep 10 | Lions Park | 1.29 | 13.1¢ | 5.4 | 2.4¢ | 239 |
| Sep 11 | Chimney Field Park Tacos | 1.75 | 17.8¢ | 6.6 | 2.7¢ | 266 |
| Sep 12 | Eastham Park | 2.19 | 22.2¢ | 8.6 | 2.6¢ | 254 |
| Sep 13 | Gertrude Mc Donald’s | 1.98 | 20.1¢ | 8.5 | 2.4¢ | 233 |
| Total | 23 Trips | 47.85 | $4.86 | 171.4 |
| Statistics | kWh | Cost | Miles | Cost/mile | Wh/mile |
|---|---|---|---|---|---|
| Minimum | 1.29 | 13.1¢ | 4.7 | 2.4¢ | 233 |
| Maximum | 3.51 | 35.6¢ | 9.5 | 4.2¢ | 417 |
| Average | 2.08 | 21.1¢ | 7.5 | 2.8¢ | 279 |
