The weather is getting colder and the daylight is getting shorter, especially with daylight savings time. The garage is a bit cold to work on the car. I’ve been staying inside focusing more on the solar system and some custom software I’ve written.
Inverter
In my previous post, I ran into problems charging the car with a 1000 watt inverter powered by the lead acid batteries that came with the car. I went ahead and purchased a cheap inverter that was capable of continuously delivering 3500 watts.
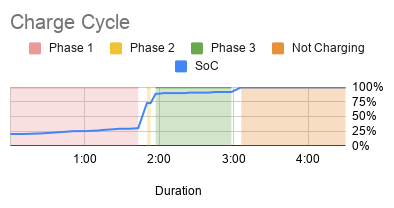
The inverter had no trouble while charging the car. I thought it may only last a half hour at first, then an hour, and another hour… eventually Teddy and I had to take the car down to the Fireball Arcade. We had exclusive access while they were closed to play some games, show off the CitiCar, and talk about maybe driving it in the Christmas parade. The batteries in the car went from a 76% charge to 93%.
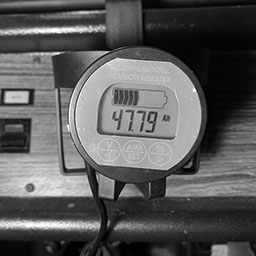
The charger had a draw around 850 watts for almost three hours. Ignoring the efficiency of the inverter, charger, EVSE, and working with ballpark figures, it turns out the batteries can store at least 53 amp hours each. However, keep in mind the batteries were still running fine when I had to take off. I may end up getting a capacity monitor for the battery bank as well.
| inverter voltage | 120 |
| amps | 5 |
| watts (volts * amps) | 850 |
| hours | 3 |
| watt hours (watts * hours) | 2,550 |
| battery voltage | 12 |
| battery bank amp hours (watt hours / volts) | 212 |
| battery count | 4 |
| battery amp hours (battery bank amp hours / count) | 53 |
I have a few inverters now.
| Brand | Sign Wave | Watts | Surge | Per Outlet | Direct | Efficency |
|---|---|---|---|---|---|---|
| Cen-tech | Modulated | 400 | 800 | N/A | 87% | |
| Sunforce | Pure | 1000 | 2000 | 500 | N/A | 90% |
| EDECOA | Pure | 3500 | 7000 | 1800 | 3500 | 88% |
There are a few things I’ve learned about inverters over the years.
Sparks
The first time you connect the inverter to the battery, you’ll see and hear a spark. An inverter has capacitors that will fill up fairly quick. If you tap the wire against the post again, you’ll probably see that there are no longer any sparks.
It’s a good idea to have a switch to cut off the battery from your inverter. A switch is meant to handle these sparks. Not probable, but in a worst case scenario, your cable will be fused to the post, or you’ll have melted bits of metal flying into your eye.
When I disconnect an inverter from a battery, I usually turn it on afterwards to drain the capacitors. It will come on briefly and beep to warn you about low voltage. Afterwards, I turn it off again and set it to the side.
Watts
The watt rating is often misleading, representing a sum. My Sunforce 1000 watt inverter could only deliver 500 watts per outlet, and therefore would not allow me to charge my car with 850 watts.
If the inverter pulls more current than your batteries can handle, it may also appear that the inverter is unable to support its advertised wattage since it may shut off as a low voltage protection feature to prevent damaging your batteries.
You may want to tear your inverter apart and verify the wire to the outlet can support the amps needed.
Grounding
Grounding is specifically used to protect your equipment from surges.
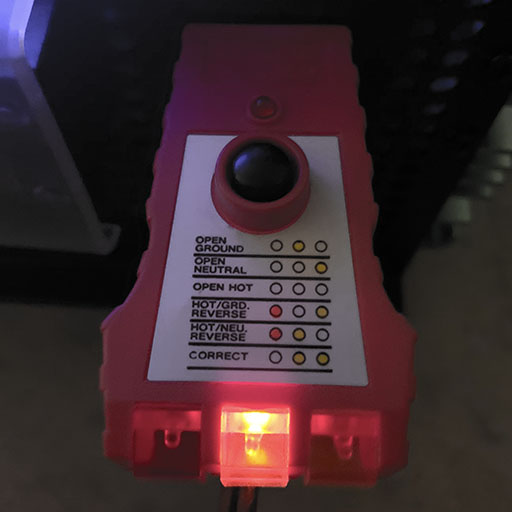
Using a receptacle tester, some inverters will show that you’ll have an open ground fault. My Sunforce inverter showed that it was wired up correctly, even though I didn’t wire it up for grounding. The Cen-Tech and EDECOA inverters had an open ground fault.
Inverters will usually have a specific area to connect a ground wire to them, or to simply connect to the body. The EDECOA inverter simply says to connect it to the body and gives you a little grounding clip. The Sunforce inverter has a labeled screw on the back. The Cen-Tech inverter has nothing on it’s plastic shell that would be conductive.
Inverters are used in two places – vehicles and structures.
The rubber tires on a vehicle will cause too much impedance to reach the ground, so it’s often recommended to connect to a specific part or the body of the inverter to the frame of a vehicle – but only if its a negative ground. A vehicles frame is often connected directly to the car batteries negative terminal to cut down on the wires needed to be ran through a car.
For structures, you’ll often have at least one eight foot grounding rod driven vertically into the earth. You’ll often be connected from the inverter to the ground rod to lower impedance.
Sometimes it’s a losing battle trying to figure out how to ground an inverter. The EDECOA inverter was a head ache, and still boggles my mind. The only way I was able to get the open ground fault to go away was when I probed the ground and neutral terminal screws for continuity. I tried connecting my houses grounding rod to various parts on the inverter without any luck.
Sign Waves
AC (Alternating Current) electricity is provided by the utility company. The voltage flip flops between negative and positive, and shows up on an oscilloscope as a bunch of round hills. An inverters job is to convert DC (Direct current) electricity into the same wave form, at the same voltage and frequency.
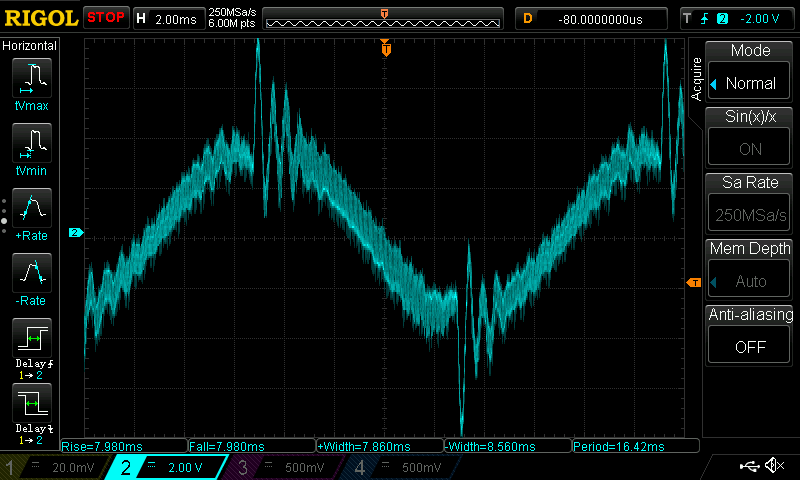
Modulated Sign Wave
The cheaper inverters often generate a modulated sign wave. They are simple to make and don’t require much hardware. The signal appears to look like stairs going up and down – or outlines of 8-bit hills. The more steps you have, the better the inverter is for your equipment. However, not every modulated sign wave is a perfect set of stairs.
This can run things like motors in a fan, drill, table saw, and incandescent light bulbs. Unfortunately a modulated sign wave can damage electronic equipment such as computers and battery chargers.
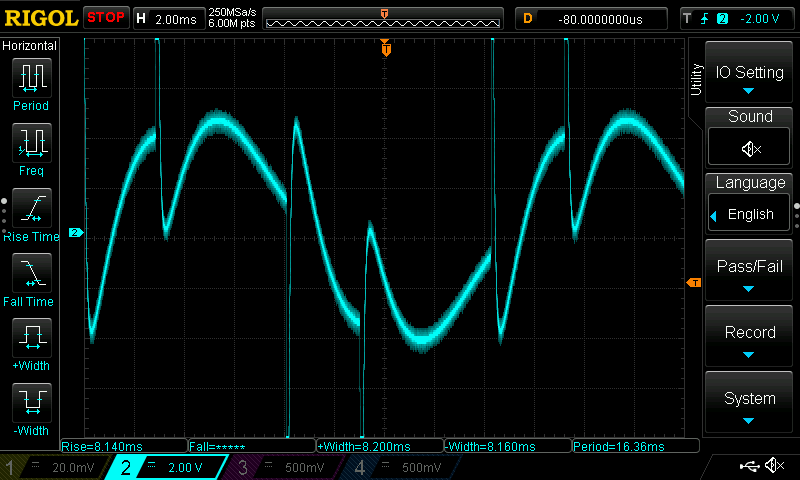
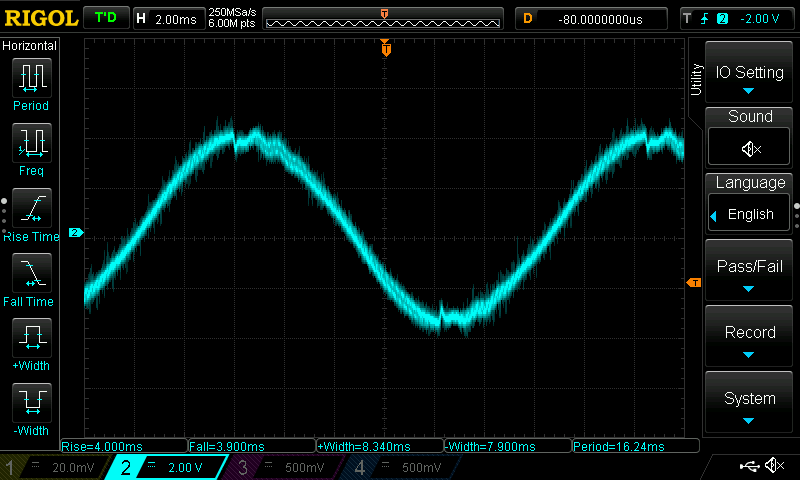
Pure Sign Wave
Also known as a true sign wave, this signal matches what a utility company provides. Your devices may depend on a pure sign wave that looks like smooth curves to regulate clock cycles, capacitors, and trigger events when various voltages are recognized. Inverters will use more components to smooth out the stair pattern into a gradual curve. Inverters that advertise that they offer a pure sign wave, may still appear to be stepped, but at a very refined scale.
How to choose
To avoid any potential problems, it’s usually best to go with a pure sign wave inverter, as that is what the manufacturer of your devices designed it for. If you are in a pinch, you may want to try the modified inverters. I would only recommend it if you are using simple equipment that doesn’t have a computer in it (power tools, coffee maker, incandescent lights). I’ve had electronics damaged from using the CEN-TECH inverter from Harbor Freight.
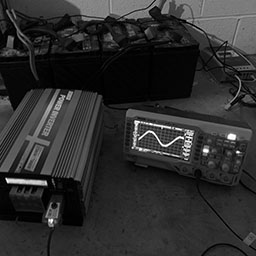
Oscilloscope
I used a Rigol DS1054Z digital oscilloscope to capture the sign waves from each of my inverters. The lines appear “fuzzy”. I believe this is because my scope is not isolated from the noise on the houses AC power from the utility company.

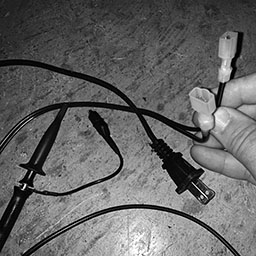
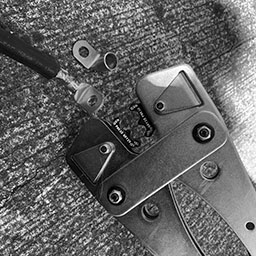
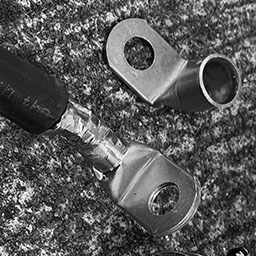
I also made my own plug to test the signal. I had an old plug from a battery charger that went bad. I stripped the wire and put male blade terminals on the end to prevent the two wires from touching themselves or me. I marked the hot wire (thin blade) in red electric tape. From here, I was able to connect my probe to the hot wire and attach the probes grounding clip on the neutral wires terminal.
Recharge
It’s been a week, and my battery bank is still recovering. At first, I was using the solar panels to charge up my battery bank. I have a few things going against me.

- 200 watt array
- Amorphous
- Approaching shortest day of the year
- Moved about 350 miles towards the north pole
- Area has shadows throughout the day
- Bad vertical/horizontal angle & no sun tracking
- A few days of rain and overcast
- Long cord
- Batteries are cool (60 degrees Fahrenheit)
I started to charge the battery bank with a 12v 4amp trickle charger when the sun is down. With MPPT, my solar panels can make better use of the voltage during the day.
When the batteries were in the car, I could recharge them in eight hours with the same charger – but each battery in series had its own 12 volt charger. In this setup, I can’t hook up four 12 volt chargers in parallel.

I’ve adjusted the panels to draw more power from the sun, but I’m fairly limited in where they are located at the moment. I’ve ordered 500 watts of polycrystalline solar panels. On days with rain, I didn’t bother hooking up the panels and stuck with the trickle charger.
I’m a bit interested in how to track the sun as well as putting a shed in the back yard for the panels.
Erratic Temperatures
When I first started charging the battery bank, I noticed the charge controller was reporting temperatures that were jumping up and down on a graph.
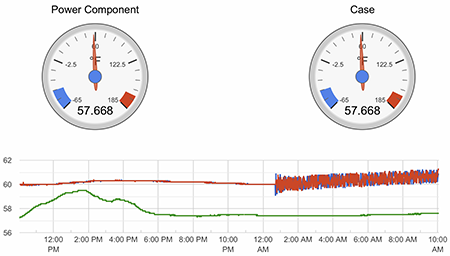
Initially, I thought this was a result of the battery trickle charger being too close to the temperature sensor and moved it further away. It had no effect on the temperature.
After a little research, what I found out is that the signal from thermocouple temperature sensors are affected by coupling from AC power running along in parallel. Sure enough, as soon as I unplugged the battery charger, the solar charge controllers remote battery sensor went back to a strait line.

I went ahead and started moving wires around to see if I could remove the coupling. When I moved the heat sensor with my warm hands, it showed up as a peak since the garage is fairly cool this time of year. It gave me a good point of reference.
I was successful in reducing the coupling noise when moving wires perpendicular to each other. I went back and tried to improve the position of everything a second time, but I suspect that maybe the trickle charger itself is having an affect in the signal of how it charges, some coupling is getting through regardless if the wires are parallel, or works from a greater distance than I realize.
The good new is that I understand what is causing it, and that the temperature sensor is still fairly close to the temperature without affecting the charge controllers charging voltage.
Solar Pi
I’ve been taking a closer look at my old software and found that the real-time data was in a separate folder.
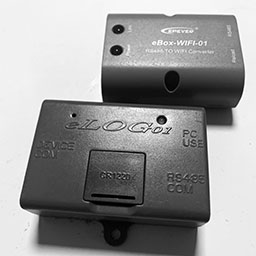
The first round of the software was working from a static CSV file that involved a manual process to retrieve the data and publish in the repository. The device was an eLOG01 and even had its own CR1220 backup battery.
Initially I tried a little device to let me access the data over Wi-Fi. The eBox-WIFI-01 device had its own Wi-Fi network to connect to. I ran into a few problems and ended up looking into other options.
Real-Time Logs
The next round made use of a Raspberry Pi and connecting to the data port via RS485 using the modbus protocol. I then started polling the controller every minute and saving its settings to a MySQL database.
It’s this website that I’ve been monitoring quite closely with temperatures and power with the load, pv array, and battery. The only issue is that I keep modifying the code to show the last hour, three hours, and 24 hours. I need to setup the interface to give me an option to do this within my browser.
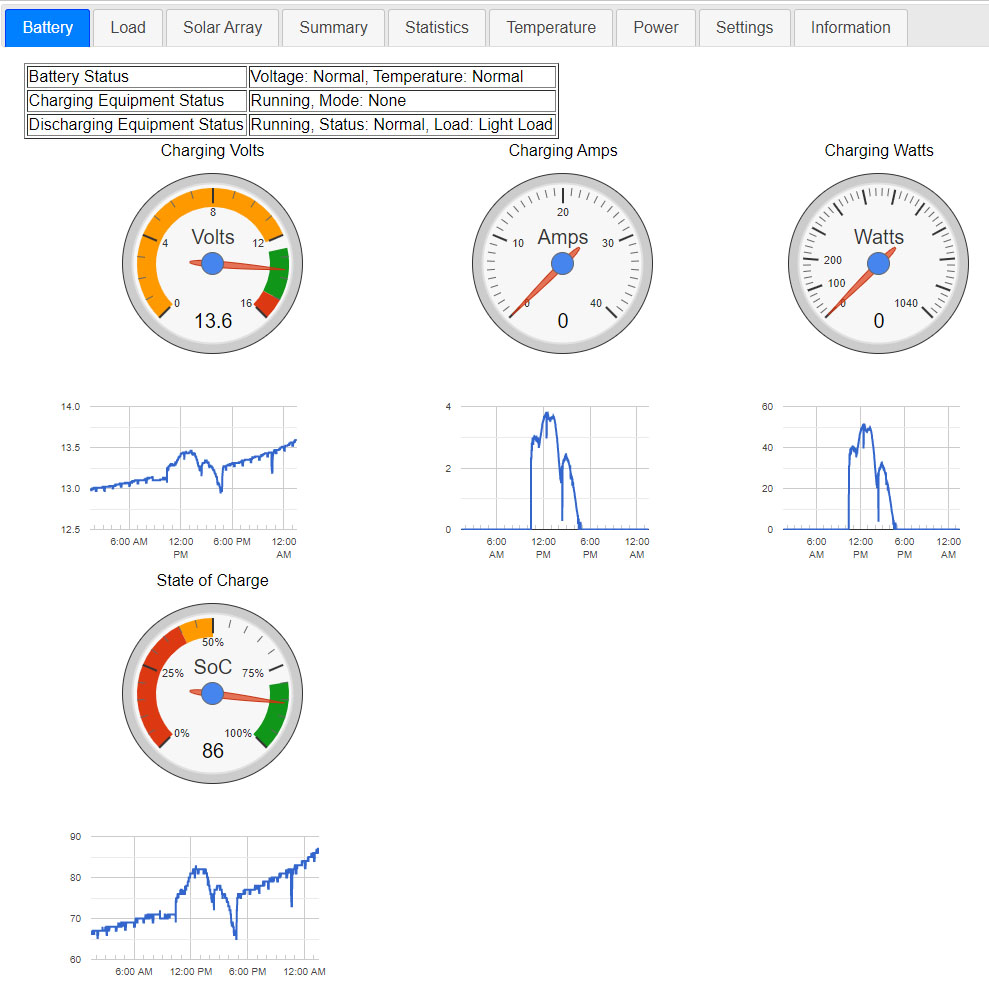
Battery
The battery tab lets me see how the trickle charger is doing compared to the solar panels. I was debating if I should keep the trickle charger on during the day instead of plugging in the panels. It looks like the panels are a little better than the charge controller.
Load
The load tab lets me see the draw of power by devices connected to the charge controllers 12 volt power supply. The charge controller can be configured to turn the supply off based on the current time, or the sun has risen/set. The raspberry Pi was powered by a usb port from this power source in my original configuration.
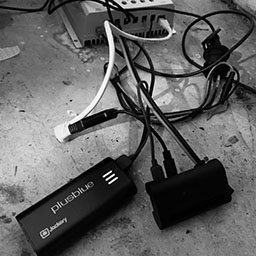
With my LED Christmas lights draining a 50 ah wheel chair battery overnight a few years back, I hooked the Raspberry Pi up to a 6000 mAh Jackery Portable Travel Charger as a backup solution. Once the loads power is cut off, the Raspberry Pi is still able to read information from the controller such as how low the battery is, and associated warnings before/if the controller shuts off.
Once this USB battery was connected to the load, I could see its effect on the load. It draws six watts briefly about once an hour, and then it draws six watts over two and a half hours once a day.
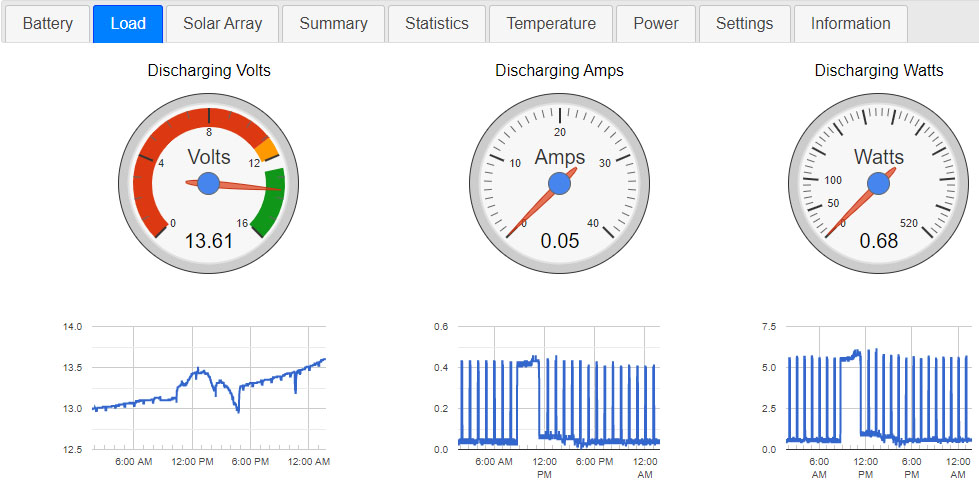
If you look at the voltage, you’ll notice it also drops a little for a brief moment every hour as well, as it’s tied directly to the battery voltage lowering during its draw.
I’m debating if I should upgrade to a higher voltage battery bank so that the load will have a consistent 12v power supply that does not decrease as the batteries are discharged.
Solar Array
Lately, I monitor the solar array to determine if I should switch over to grid power to continue charging the battery bank. I can set it up to show me how the panels have been doing over the past few days. I’ve been pulling 55 watts at most on a 200 watt system. Notice the peak on the third day is much thinner. I had left the solar panels disconnected in the morning due to rain until things cleared up.
With the low wattage and a larger battery bank then when I first setup the system, I decided to purchase some new panels.

Usually I’ll flip between the battery, load, and solar tabs to review where the watts are coming from, and where they are going. I’ll need to setup something that’s a bit more easier to compare the information I’m looking for.
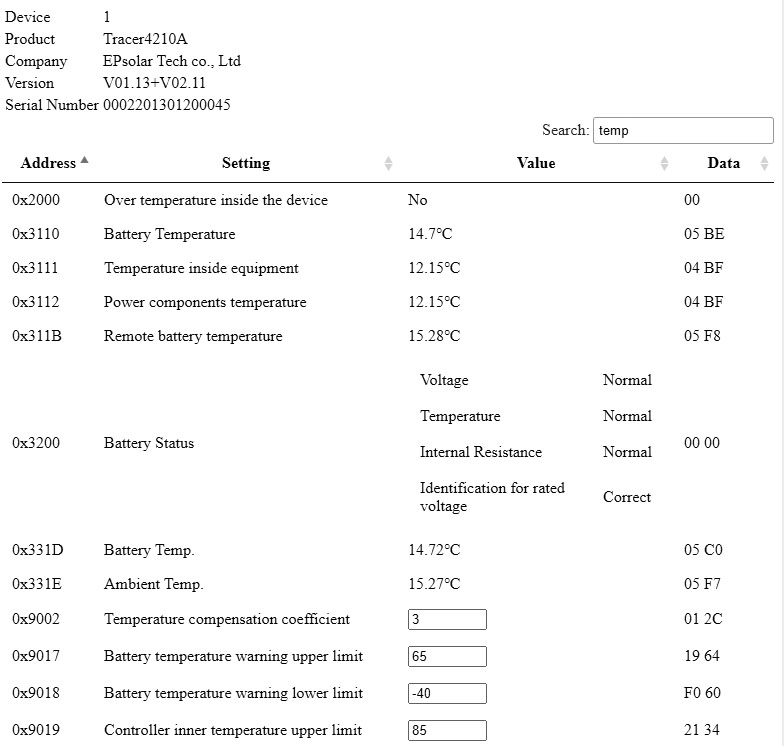
MODBUS Editor
Currently I modify settings on the controller with a device called an MT-50 Remote Meter. I end up removing the raspberry pi data cable and losing track of data while I’m plugged in.
I’ve started working on an editor to modify the settings directly through the raspberry pi website. I’ve got most of everything working to read the data and display lookup lists and input boxes. I’m on the cusp of the actual goal to send write requests to the solar charge controller. The new setup is pretty powerful.