

Upon purchase of the CitiCar, the voltage meter was not operating. The following information was found regarding the volt meter in the manuals provided with the vehicle.
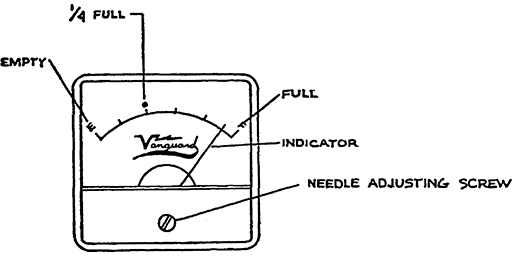
3. VOLTMETER (see diagram below)
The Voltmeter is designed to show the usable amount of electrical energy that the batteries have left. The “E” indicates a full discharge. “F” indicates a full charge and the red dot indicates about ¼ of a charge left. An accurate reading can be obtained when the accelerator pedal is fully depressed and the CitiCar is running at cruising speed. This gauge gives only an approximate reading, as you become more familiar with your CitiCar, you will be able to better estimate your CitiCar’s state of charge at any given time.
CitiCar 1976 ½ Owners Manual, Page 12
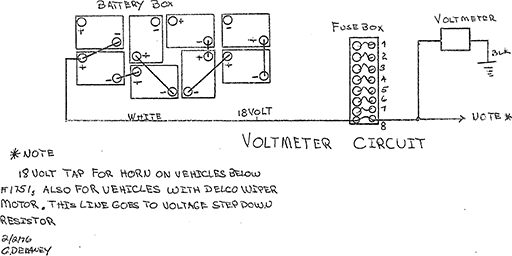
The preface of the CitiCar service manual states that the voltmeter runs off of 18 volts.
WIPER MOTOR NOTES
It should be noted that all Delco wiper motors were connected on the 18 volt circuit serving the voltmeter, horn and wiper and the voltage was stepped down to 12 volts by a resistor that was mounted on one of the anchor bolts of the motor. This should always be checked when trouble shooting motor problems and replaced if it is not sending a full twelve (12) volts to the motor. If the resistor is sending more than 13.8 volts, it should also be replaced as more voltage than 13.8 will damage the motor.
CitiCar Service Manual, Page 31
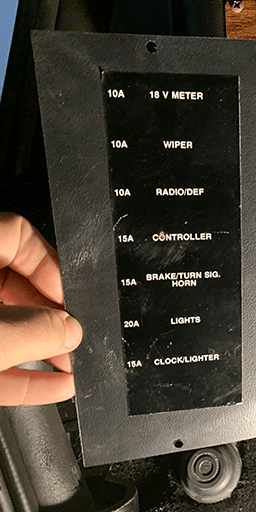
The fuse chart on page 63 of the service manual also states that the Volt Meter (Second Design Dash) fuse is in position one (far left) and uses a 10 Amp fuse.
Troubleshooting
With this information on hand, diagnoses began. The list of fuse positions for the voltage meter conflicted with the schematic for the voltage meter circuit. The fuse box was checked and appeared to be missing an unlabeled fuse. Visually, all of the glass fuses available looked fine without any open circuits. A multi-meter was used to check for continuity. All fuses were verified as still intact.
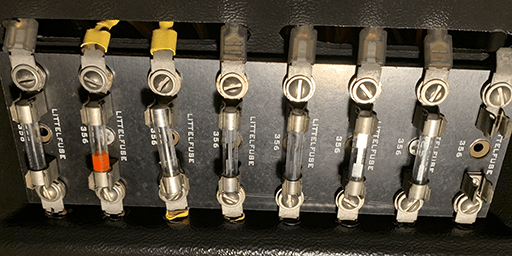
Some spare automotive glass cartridge (AGC) fuses for 10, 15, and 20 amps were purchased along with a tool to pull them out. Having the fuses on hand would potentially avoid a costly situation with a tow truck due to a blown fuse. A 30 amp fuse mentioned in one of the schematics was picked up as well to save a second trip.
There were two loose wires in the battery box, and it contained four 12 volt batteries. The schematic to tap into the third 6 volt battery wired in series as 18 volts was not possible in this configuration. However, the schematic identified the loose white wire being used to control the voltage meter.
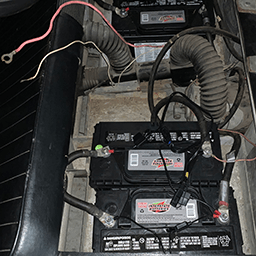
As each battery terminal was tapped with the white wire, the voltage meters needle moved in the wrong direction. It appeared as if the polarity was reversed. All terminals exposed this same behavior except the last one connected to the thick positive wire going to the contact switch. In that case, the needle didn’t move.
The thin red wire attached to that terminal was moved to the previous batteries positive terminal. The voltage meters needle did not move. The red wire was then moved to the negative terminal. The voltage meter shot up past full when the white wire was taped against the other batteries positive terminal where the red wire was originally attached.
Stepping Down to 18 Volts
Members in an electronics group provided a few suggestions of how to step the voltage down from 24 volts to 18 volts. There was a wide variety of solutions ranging from using resistors, potentiometers, Zener diodes, and various combinations.
An adjustable DC power supply, some alligator clips, voltage meter, and an assortment of electronic components were used to experiment with. A few variations were tested. A 6 volt Zener diode (1N5233B) had the best outcome.
Diodes usually allow electricity to flow in one direction only. A Zener diode doesn’t let electricity pass in the opposite direction until it meets a specific voltage threshold. All voltage over that threshold is passed along in the circuit.
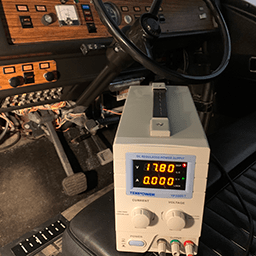
It was now time to verify the solution would work in the car. The Zener diode was connected between the white wire and the positive terminal for 24 volts. The voltage on the series of two 12 volt batteries was at 25.6 volts. The meter detected this voltage as almost full.

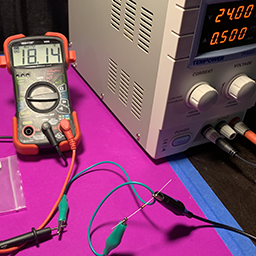
The next step was to identify the actual voltage on a 24 volt battery compared to the stepped down 18 volt reading. The lab bench power supply was hooked directly to the voltage meter. Each mark on the voltage meter was identified with the matching voltage.
Afterwards, the power supply returned to the lab and tests were performed with the Zener diode and multi-meter. Different voltages were tested to evaluate which ones would move the needle to the mark on the voltage meter in the car.
These voltages were then calculated to determine the 24 volt battery banks state of charge (SoC). During research, various resources gave different values for a lead acid batteries voltage compared to its charge state.
| Charge | Voltage | Charge | Voltage |
| Max | 28.20 | 50% | 24.12 |
| 100% | 25.40 | 40% | 23.80 |
| 90% | 25.00 | 30% | 23.50 |
| 80% | 24.84 | 20% | 23.16 |
| 70% | 24.64 | 10% | 22.62 |
| 60% | 23.80 | 0% | 21.00 |
| Meter mark | Meter volts | 6 volt Zener Diode | 24 volt State of Charge |
| Red Mark 1 – E | 13.9 | 19.75 | Deeply discharged |
| Mark 2 | 15.3 | 21.15 | very close to 0% |
| Mark 3 – Red Dot | 16.6 | 22.45 | 9% |
| Mark 4 | 17.8 | 23.66 | 32% |
| Mark 5 | 19.0 | 24.86 | 80% |
| Mark 6 – F | 20.3 | 26.26 | Charging |
Since the meter is connected to 24 volts, it is also connected to the other set of batteries in parallel and gives a more accurate reading of the entire battery bank. This reduces potential unbalanced batteries since all four batteries are used to get a voltage reading unless the car is charging, or on the third contact switch when all four batteries are wired in series.
Voltage Drop Adapter
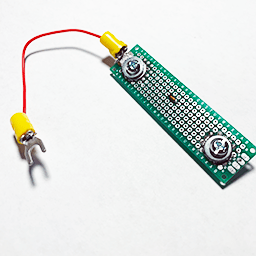
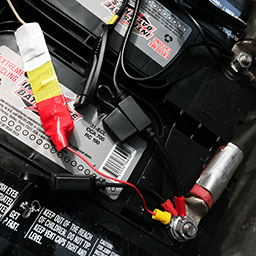
Two holes were drilled into a small prototyping board. Afterwards, two washers were soldered to each side of the board, along with the 6 volt Zener diode connecting to each one. Screws and nuts were then used to attach wires to each side of the board. An extra wire had some terminals crimped, soldered to each end, and then screwed onto the board.
Once the connections were confirmed to be intact and the voltage drop tested for one last time, the PCB board was wrapped in electrical tape. Tape around each washer was cut away to expose the contacts. Once the wires in the car were connected to the adapter, each end was wrapped in different colors. White corresponded to the white wire wire for one side, and red for the positive terminal on the power supply.
Next Steps
Tests will need to be performed to verify how the load affects the voltage, how quick the batteries drain, and at what point does the motor cease to stop working.
The wire between the PCB and battery needs to be improved. It’s too small and rigid, and has a high chance of breaking due to vibration or general movement. The wire may need to be thicker so that the 10 amp fuse breaks before the wire heats up.
A custom PCB could be created that already has an exposed contact pad to screw in the terminal and have an overall smaller footprint. A small plastic box could make it appear nicer.
It may be possible to make a custom insert to the voltage meter and add ticks for each state of charge going from 0% to 100% in 10% increments. The space between 0% and 10% would probably be much wider than that between 90% and 100%. This would give a better idea of battery percent compared to how far the car has been driven so far. It could also be colored in the traditional red, yellow, green colors to get a quicker idea of the general overall state.
