
I’ve been getting out more and going off the diet. I’ve gained back 15% of the weight I’ve lost so far, visiting restaurants that I hadn’t been to in a long time, and raiding the fridge. It’s a guilty pleasure, and I need to find some motivation to get back on the diet. I also need a few more destinations other than fast food restaurants.
I took Teddy back down to Eastham park, and he got to play with two dogs. It’s been months since he’s chased another dog, and his tongue was hung out most of the time. Still trying to test the limits of the car, I decided to take a detour to Dunkin’ Donuts and pickup one of my favorite snacks – Boston cream doughnuts. The woman at the drive-through offered Teddy a “Pup Cup”. It didn’t last long.
New GPS Record
With a total trip of 9.5 miles, the little trek tied with the current record during the Custard Package Dropoff… with the old speedometer. Once I can break the record, I’ll no longer have that old vs new speedometer accuracy to complain about. I know without a doubt that today’s trip was the furthest the car has gone, but I want an accurate reading that can beat the inaccurate one. I’ll keep trying to push the car further.
The batteries still had 48.1 volts when we arrived home. The battery meter indicated that they had a 52% charge. I believe with 12 volt batteries, I should generally avoid going down below a 50% charge.
Energy usage over time
Since I had 23 trips last night, I updated the chart to be less noisy with 46 columns and growing. The new format makes time relative, so you can see a long line from the end of July to the middle of August when the motor was out of the CitiCar. Today’s trip is not on the image here.
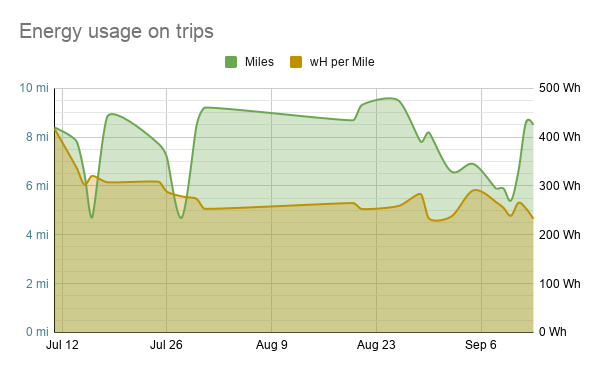
I had started recording the data to determine if longer trips would affect the amount of energy per mile, and to see what effect my changes have.
Improving Range
It appears that the energy usage was fairly high at first, and then settled down. I attributed the improvement to changing my driving style in the CitiCar, and adjusting the brakes. It seemed to level off for some time, averaging around 275 wH/mile until recently.
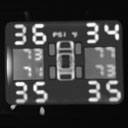
In recent trips, I am now seeing peaks matching up with each other in both total miles and wH/mile. I originally believed this might be due to the accuracy of the speedometer installed on September 5. There are matching peaks and valleys just before that, which may actually be related to when I installed the TPMS system and inflated the tires from 20 psi to 35 psi. The ride is a little harder at times, but I now believe that the tire pressure has made the most difference.
Energy on Long Trips
The total miles traveled now looks as if it may have an impact on the watt hours used per mile now. This is probably due to the energy consumed during different phases of a lead-acid batteries charging cycle the further the battery is discharged. I’m uncertain, but I believe more energy is used during the bulk phase. The further the battery is below an 80% charge, the more energy will be consumed to return it to a full charge.
| Phase | SoC | Voltage | Current |
|---|---|---|---|
| Bulk | < 80% | Increase | Stable |
| Absorption | < 100% | Stable | Decrease |
| Float | 100% | Stable | Stable |
Warning Signs
On a side note, I noticed the brakes had a bit of a high pitch twice during today’s drive. Hopefully it’s nothing, but I’m noting it here in case it continues and it’s something to reflect on. I hadn’t noticed any other change in the brakes handling on hills or level roads. The weather was a clear sunny day.
Charging Results
The numbers are in. I caught the chargers just as the last one turned green.
| Charging Time | 10 hours 28 minutes |
| Charging Speed | 0.91 miles per hour |
| Mile Time | 1 hour 6 minutes |
| Kilowatt hours | 2.30 kWh |
| Mile watts | 242 wH |
| Mile Cost | 2.5¢ |
| Trip cost | 23.3¢ |
